
Upcoming Webinar / Batch
Wealth Creation Seminar
(online & offline)
27th JAN 2024
Time 4:00 PM
BECOME A PROFESSIONAL
FOLLOW THE PROCESS
MONEY WILL FOLLOW
Financial Literacy
Financial Literacy
Mentorship Program for Traders
Distinguish between investment, trading, speculation and formulate your financial decisions according to your objective.
Financial Literacy
Financial Literacy

Why Skill Raise ?
Sumedh Baghla is an entrepreneur trader trainer having more than 15 years of experience.
Our courses lay emphasis on acquiring life changing skills and not theoretical
knowledge.
Attending our course will be a life changing experience for you that will make you stand out in the crowd.
Dedicated support after course completion
Placement guarantee for job oriented courses
100% Job oriented add-on course along with graduation and post-graduation
Industry recognized programWorkshops and other programs and meetings with industry experts.
Become 100% confident to trade and earn Money back guarantee
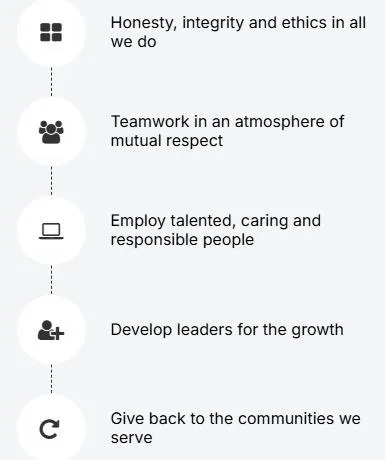
VALUES

Fill this form if you need to talk
Unable to find form